How to read SMPTE bars, EBU bars and PM5544
Our TV screen test ships three patterns that are older than most of the people who use them: EBU color bars, SMPTE color bars and the Philips PM5544 test card. They were made for analog television, to line up studio monitors and to fill the screen between programs. Much of what they were built to measure no longer exists inside a modern screen. Some of it does, and a few parts have found new jobs.
Below is where each one came from, what every part was designed to check, and what is still worth looking at on a TV, monitor or projector. We went back to the standards and to the papers the engineers published at the time. They’re listed at the end.
Why color bars come in that order
Color bars almost always run white, yellow, cyan, green, magenta, red, blue, often with black last. The order isn’t arbitrary. Each bar is one of the eight ways to switch the three primary colors fully on or off. Write each bar as three switches in the order green, red, blue, and the bars count down in binary from 111 for white to 000 for black. A generator needs only three square waves to draw them: blue switching at every bar, red at every second bar and green at every fourth.
The same count puts the bars in order of brightness. Green carries most of what the eye reads as brightness, red less and blue the least. In the standard-definition video formula, ITU-R BT.601, brightness (luma) is 0.587 of green plus 0.299 of red plus 0.114 of blue. Add up each bar and you get white 100%, yellow 89%, cyan 70%, green 59%, magenta 41%, red 30%, blue 11% and black 0. Each bar is darker than the one before it, so the bars double as a gray scale.
Electronic color bar generators date from the first years of color TV. RCA engineers Norbert Larky and David Holmes filed a patent for a color test pattern generator in 1951, and it was granted in 1956.
Most bars don’t run the colors at full strength, and the reason is practical. ITU-R BT.471 names bar signals with four numbers: the level of the white bar, the black bar, and the highest and lowest levels in the colored bars, each as a percentage of white. At full strength (100/0/100/0), the color signal for yellow and cyan swings about a third higher than white: 131 to 133 IRE units against 100 in NTSC, according to SMPTE’s own background guide. In SMPTE’s 75% bars, yellow and cyan peak at exactly 100. So everyday bars hold the colors at 75%, which keeps the test signal inside the range of the system it is testing.
EBU color bars
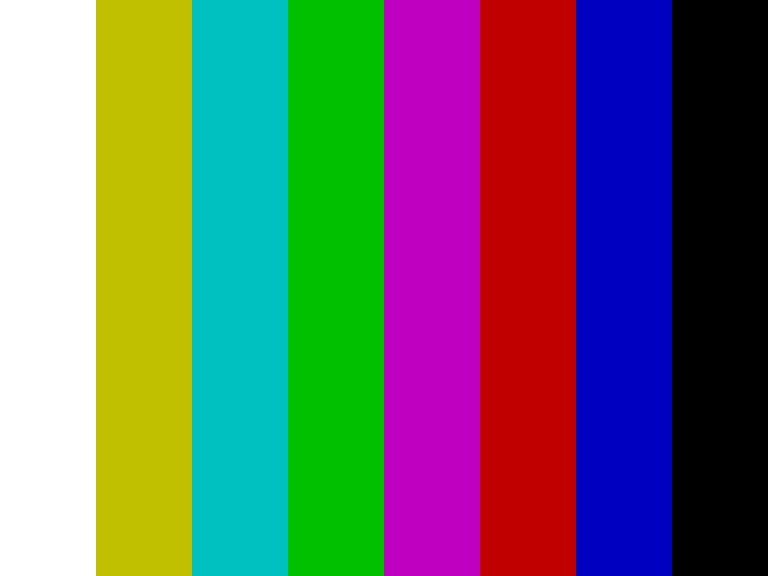
EBU bars are the 100/0/75/0 kind: white at full level, the six colors at 75%, then black. The EBU name comes from their use in European broadcasting; the ITU standard simply calls them 100/0/75/0.
Our file draws eight equal bars in a 4:3 frame, 768 by 576, the square-pixel size of a PAL picture. On a widescreen display the eighth bar, black, runs into the black border at the side. That’s expected.
On a modern screen, look for three things:
- Each bar should be flat. One even color from top to bottom. The image is perfectly uniform, so a bar that shifts in tint or looks brighter in the middle than at the ends is showing you the panel or its backlight.
- The bars should step down. Turn the TV’s Color (saturation) control all the way down and the bars become a gray staircase that gets darker from left to right, one clear step at a time. Put the control back afterwards.
- The colors should look strong, not neon. In a vivid or dynamic picture mode, yellow and cyan tend to glow, and the edges between bars pick up thin light or dark outlines. Those outlines are the TV’s sharpening, not part of the pattern.
EBU bars are the wrong pattern for the blue-only check described below. Their white bar is at full level while the blue in the colored bars is at 75%, so through blue only the white bar always looks brighter. SMPTE bars start with a 75% gray instead, so all four bars that carry blue carry the same amount.
SMPTE color bars
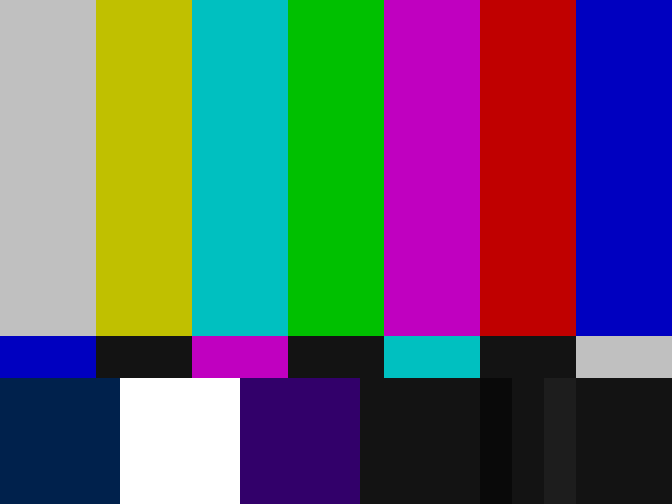
SMPTE bars are the pattern most Americans picture when they hear “color bars”, and they began as a fix for one specific problem. In 1977, A. A. Goldberg of the CBS Technology Center presented them at the NAB engineering conference. CBS had been studying how studio monitors drift since 1975. Monitors had to be checked, usually before every show, so that a whole bank of them matched. The usual way to set color and tint was to switch off the red and green guns and compare the blue bars by eye, and it wasn’t accurate: the bars to compare were far apart, a monitor’s blue could vary from one side of the screen to the other, and the eye is not very sensitive to blue.
Goldberg’s change was small. Under the main bars he added a thin strip of patches in reverse order, so every bar that needed matching had its partner right below it. In the black area at the bottom right he added a PLUGE signal for black level. CBS used the new pattern for six months at its network facilities in New York and found that settings made by eye were as accurate as settings made with a precision photometer. CBS chose not to patent it, which put it in the public domain. SMPTE published it as ECR 1-1978, then as engineering guideline EG 1-1990.
Our file follows that layout:
- Top two thirds: seven bars at 75%, starting with gray instead of white.
- The thin strip: blue, black, magenta, black, cyan, black, gray. These are the four bars from above that carry blue, in reverse order, with black between them.
- Bottom quarter: −I, a 100% white square, +Q, black, and the three PLUGE stripes in the black area on the right. −I and +Q are NTSC color signals for checking a decoder on a vectorscope; on a computer screen they’re two dark squares and test nothing.
Color and tint, through blue only
Switch the screen to blue only. Some TVs and projectors have a blue-only mode among their expert or calibration settings. A deep blue filter held in front of your eyes does the same job, and some calibration discs used to come with one. Only the bars that contain blue stay lit: gray, cyan, magenta and blue, plus the patches below them.
- Color (saturation): adjust until the outer two bars, gray and blue, match the patches directly below them.
- Tint (hue): adjust until the inner two, cyan and magenta, match theirs.
Set color first, because it moves all four bars, then tint. When both are right, the edge between each bar and its patch disappears. A TV fed by a computer has no analog decoder left to drift, but its Color and Tint controls still act on the picture. At their neutral settings in a movie or filmmaker mode, bars and patches should already match. If they don’t, a control has been moved or the picture mode is adding color of its own.
PLUGE and black level
PLUGE comes from Picture Line-Up Generating Equipment, an idea from the BBC. A 1966 note in Electronics Letters by S. F. Quinn and C. A. Siocos of the Canadian Broadcasting Corporation describes how it works. In a black area sit two narrow stripes, one slightly blacker than black and one slightly lighter. Turn the brightness down until the darker stripe disappears into the black around it while the lighter one stays visible. At that point black is as deep as it can go without swallowing anything above it.
Quinn and Siocos also found something that still holds. They measured the light reflected off the screen of a switched-off monitor and found that the right PLUGE setting moved with it, and their figures no longer applied in a brightly lit control room. ITU-R BT.814, today’s international PLUGE standard, says the same: the adjustment depends heavily on the viewing conditions. Set black level in the light you actually watch in.
In SMPTE bars the PLUGE has three stripes, at 3.5, 7.5 and 11.5 IRE units. The middle one is the black of the picture. North American NTSC put black at 7.5 IRE, a little above the signal’s blanking level, which left room for a stripe below it.
PLUGE on a computer screen
Here the broadcast rule needs translating. Our file stores the three stripes as RGB 9, 19 and 29 out of 255, which is 3.5%, 7.5% and 11.4% of white. A computer screen’s black is 0, so the pattern’s own black is a very dark gray, and even the “blacker than black” stripe sits above true black. If you turned the brightness down until the left stripe vanished, you would be crushing real shadow detail.
Read it this way instead:
- All three just visible: on a well-set screen in a dim room, you can make out all three stripes, the left one only barely. On a widescreen display, the black bars at the sides are true black and look a shade darker than the pattern’s own black.
- Left stripe gone: if it merges with the middle one, shadows are being crushed. Brightness is too low, a dynamic contrast mode is at work, or the signal levels don’t match (see the next section).
- All three obvious: if they stand out easily and the black at the sides looks gray, black is lifted.
The HD version
SMPTE bars were drawn for 4:3 standard definition. For HDTV, Japan’s ARIB published a multiformat bar pattern, STD-B28, in 2000, and SMPTE adopted it as RP 219 in 2002, revised as RP 219-1 in 2014. It is built for 16:9, works in both HD and SD, and has its own ramp and PLUGE. Our test shows the classic 4:3 layout.
The range mismatch PLUGE still catches
Computers usually send RGB from 0 to 255, called full range. TVs often expect video levels, where black is 16 and white is 235, called limited range; those are the code values ITU-R BT.709 uses for HD video. Intel’s own driver guide notes that limited range is most common on TVs and recommends full. Both are normal. The trouble starts when the two ends disagree, which happens a lot with a laptop on HDMI.
- Computer sends full, TV expects limited: everything at 16 or below is shown as black. The left PLUGE stripe and the border melt into one black, the middle stripe is just 3 steps above it, and shadow detail in films and games disappears. Everything above 235 clips to white.
- Computer sends limited, TV expects full: black arrives as 16 and is shown as dark gray. The whole picture looks flat and washed out, and the black bars beside the pattern look gray.
The fix is to make both ends agree. On the computer the setting is called Quantization Range (Intel), Output dynamic range (NVIDIA) or Pixel Format (AMD). On the TV, look for HDMI Black Level, HDMI Video Range or something similar. With the SMPTE bars on screen you can see the moment they agree: three stripes, the left one barely there.
Philips PM5544
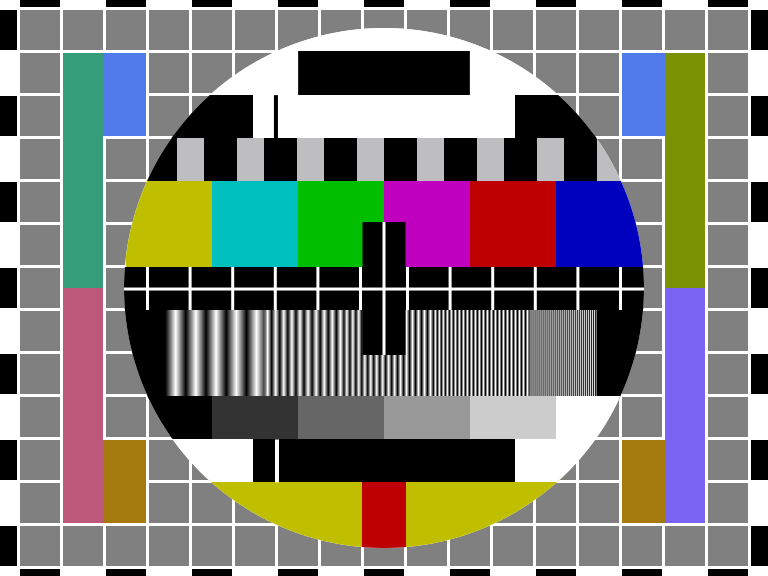
The PM5544 is the circle test card that much of the world saw when a channel had nothing else to show. Philips built it at its TV test-equipment lab near Copenhagen in the late 1960s, and the Danish engineer Finn Hendil is credited with its layout. Philips described it in 1970 in its quarterly Electronic Measuring and Microwave Notes.
Earlier test cards were usually artwork in front of a camera, or etched into a special camera tube called a monoscope. The PM5544 generated the whole picture electronically. Even the circle was drawn by digital logic, line by line, from a ferrite-core memory, with a diameter of about 83% of the picture height and an error under 1%. Philips wrote that no international recommendation covered a combined test pattern, so they gathered the test signals they expected to stay useful. The aim was to check and adjust a TV set, monitor or decoder just by looking at the screen, with no other instrument.
Here is what each part was for, according to Philips, and what it tells you now.
- The circle is only round when the aspect ratio and the scanning are right. Today an oval means the picture is being stretched, usually by a TV picture-size setting such as Wide or Zoom, or by a resolution the screen has to scale to fill. Our test keeps the card at 4:3, so the browser isn’t the cause.
- The grid should be made of squares, for the same reason. On a CRT it was also used for convergence. On a projector it is still handy: it shows keystone correction and whether focus holds out to the corners.
- The border castellations, the black and white blocks around the edge, showed whether a set was overscanning, cutting off the edges of the picture. Some TVs still do this to HDMI inputs unless a setting usually called Just Scan, Fit to Screen or Full Pixel is on. On a widescreen TV our card fills the height, so if the top or bottom row of blocks is cut, the TV is cropping every side and rescaling everything it shows.
- The center cross had a horizontal line built from the two interlaced fields in the opposite order to the grid lines, so bad interlacing made the two kinds of line visibly different in width. On a progressive panel it’s simply the center mark.
- The black and white blocks above the color bars are a 250 kHz square wave at 75% level, for spotting overshoot and ringing. Today a bright or dark outline along their edges means the TV is sharpening.
- The color bars are 75% bars, a reference for saturation. With the red and green guns switched off, the blue bars should match the 75% gray blocks just above them, the same idea as the SMPTE check.
- The gratings are five groups of sine-wave stripes, 0.8, 1.8, 2.8, 3.8 and 4.8 MHz in the PAL version, showing how much fine detail a set could pass. On a normal set the first three kept full contrast and the finest group only a little. Today each group should look like clean, even stripes. Shimmering moiré or halos mean something is resampling or sharpening the picture: the TV’s scaler, its sharpness setting, or a window that isn’t fullscreen.
- The gray scale has six steps from black to white; ours runs 0, 20, 40, 60, 80 and 100%. Every step should be distinct, and every gray neutral, with no blue, green or pink cast.
- The red block on yellow at the bottom of the circle checked that color and brightness arrive at the same moment. Philips said it took many experiments to settle on red on yellow. Digital video can still carry color at a lower resolution than brightness (chroma subsampling), but a block this size shows it only as a slightly soft edge.
- The needle pulses, the thin lines beside the black and white steps near the top and bottom of the circle, were a reflection check for echoes from cables and antennas. The colored bars on either side carried PAL color-difference signals for checking the decoder. In a digital picture, neither has anything left to check.
What these patterns can’t tell you
They’re references for your eyes, not measurements. They show when a picture is stretched, cropped, crushed, clipped or oversharpened, and they make some color errors obvious. They can’t put a number on color accuracy, peak brightness or backlight uniformity; that takes a colorimeter and calibration software. Our monitor calibration page covers what you can set by eye. They’re also standard dynamic range images. HDR has its own versions, and BT.814 now includes PLUGE signals for HDR, but a browser shows these patterns in SDR.
Try them
Open the TV screen test and choose Broadcast patterns. Click, tap or press the space bar to step through, and press Esc to leave. The bar along the bottom and the close button fade after a few seconds so nothing covers the pattern; move the mouse or tap to bring them back.
For a TV, use its own browser or a computer on HDMI. Casting a tab or mirroring a phone sends compressed video, which softens the gratings and can shift the near-black stripes the PLUGE depends on.
Sources
- Philips (1970), Combined colour/monochrome pattern generator PM 5544, and Applications of the new monochrome and colour test-pattern generator PM 5544, Electronic Measuring and Microwave Notes 1970/2, pp. 1–6 and 28–31
- Wikipedia, Philips circle pattern (design history and the credit to Finn Hendil)
- Goldberg AA (1977), A Monitor Alignment Color Bar Test Signal, NAB Engineering Conference Proceedings, pp. 84–85
- SMPTE EG 1-1990, Alignment Color Bar Test Signal for Television Picture Monitors
- SMPTE EG 27-2004, Supplemental Information for SMPTE 170M and Background on the Development of NTSC Color Standards
- Quinn SF, Siocos CA (1966), PLUGE method of adjusting picture monitors in television studios: a technical note, Electronics Letters 2(5): 180–181
- ITU-R BT.814-4 (2018), Specifications of PLUGE test signals and alignment procedures for setting of brightness and contrast of displays
- ITU-R BT.471-1 (1986), Nomenclature and description of colour bar signals
- ITU-R BT.601, Studio encoding parameters of digital television for standard 4:3 and wide screen 16:9 aspect ratios
- ITU-R BT.709, Parameter values for the HDTV standards for production and international programme exchange
- Larky ND, Holmes DD, US patent 2,742,525, Color test pattern generator (filed 1951, granted 1956)
- ARIB STD-B28 (2000), Multiformat Color Bar
- SMPTE RP 219-1:2014, High-Definition, Standard-Definition Compatible Color Bar Signal
- Intel, Quantization Range option in Intel Graphics Software, Intel Graphics Control Panel, or Intel Graphics Command Center